
September 16, 2026
Revenue Per Visitor vs Conversion Rate: Which One Should Decide Your A/B Tests?

A few years ago I watched a team celebrate a test that had just cost them money.
They’d added a “Save 30% today” banner to a sales page. Conversion rate jumped from 3% to 3.9%. The tool showed a big green checkmark. Everyone was happy. Nobody looked at average order value, which had dropped from $97 to $68 because buyers were skipping the order bump and picking the cheaper option. Revenue per visitor went down. They shipped the banner anyway, because the only number on the screen said “winner”.
That’s the whole problem with conversion rate as a primary metric in a funnel. It measures whether people clicked. It doesn’t measure whether you got paid. If your funnel has an order bump, an upsell, a downsell or a subscription, then roughly half of a visitor’s value happens after the moment conversion rate stops looking.
This post walks through the difference between revenue per visitor and conversion rate, when each one deserves to be the primary metric, and how to set up a test so the money decides.
Key takeaways
Conversion rate tells you how many people bought. Revenue per visitor tells you how much you made per person who showed up. They can move in opposite directions.
Discounts, urgency and scarcity almost always trade order value for conversion rate. A test that only measures conversion rate can’t see the trade.
Use revenue per visitor as the primary metric on any page that sells something. Keep conversion rate as a guardrail that can veto a result.
Revenue tests need more traffic. Make up for it with bigger changes, Bayesian stats, bandit allocation and outlier caps, not by measuring the wrong thing.
What is revenue per visitor?
Revenue per visitor (RPV) is total revenue divided by the number of unique visitors. It equals conversion rate multiplied by average order value, so it captures both how many people buy and how much they spend.
For a funnel, “total revenue” should mean everything the visitor bought in the session: the main product, the bump, the upsells, the downsell, the first payment of any subscription, minus refunds. That’s the number your bank account sees. Anything less is an approximation.
Conversion rate (CVR) is buyers divided by visitors. Average order value (AOV) is revenue divided by orders. RPV is what you get when you multiply them, which is why it can’t be fooled by a change that moves one up and the other down.
The test that won and lost money
Here’s that discount test again with all the numbers filled in.
Visitors | Orders | Conversion rate | Average order value | Revenue | Revenue per visitor | |
|---|---|---|---|---|---|---|
Control | 10,000 | 300 | 3.0% | $97 | $29,100 | $2.91 |
Variant B | 10,000 | 390 | 3.9% | $68 | $26,520 | $2.65 |
Variant B lifted conversions by 30%. It also cut revenue per visitor by 9%. Ship it and you lose about nine cents on every visitor for as long as it runs. On a funnel doing 50,000 visitors a month, that’s over $4,000 a month gone, hidden behind a green checkmark.
The discount did exactly what discounts do. The measurement was the failure.
Why conversion rate misleads in funnels specifically
Conversion rate is a perfectly good metric when there’s one binary outcome and every outcome is worth the same. A newsletter signup, for example. Funnels break both assumptions.
Not all conversions are equal. A $47 buyer and a $47 buyer who also took a $197 upsell are both “one conversion”. They are not the same customer.
The conversion you can see isn’t the last one. Test an order form on its own conversion rate and you’re blind to what happens on the next three pages. A pushier order form can win on checkout rate and lose on upsell take rate, because it used up the buyer’s goodwill before the OTO.
The easiest levers all trade AOV for CVR. Discounts, countdown timers, “only 3 left”. They’re quick to build and quick to produce a fake win when you only look at one side of the ledger.
Where conversion rate still earns its place
None of this means you should stop watching conversion rate. It just has a different job.
Conversion rate moves fast and it’s sensitive. That makes it the right metric for catching breakage: a payment form that fails on mobile, a variant that loads slowly, a headline that quietly confused people. When CVR drops hard on one variant, you find out in a day instead of a month.
So treat conversion rate as a guardrail, a metric that can veto a result, and let revenue per visitor be the primary metric that decides it. A variant that wins on RPV while conversion rate craters still deserves a hard look before you ship it. You may have caught a lucky handful of big orders rather than a real effect.
The honest cost of measuring revenue
There’s a real reason most tools default to conversion rate. Revenue is noisier.
A conversion is 0 or 1. Revenue per visitor runs from 0 to whatever your biggest bundle costs, and a few large orders can swing the average. In practice a revenue metric needs several times more traffic than a conversion metric to detect the same relative lift at the same confidence. If you run a low-traffic funnel, that’s a real constraint, not a footnote.
Four things make it workable.
Test bigger changes. A new offer structure or price point produces an effect you can see. A button colour doesn’t, on any metric.
Use Bayesian statistics. You get a probability that each variant is best and an estimate of how much you’d lose by picking wrong, and you can read both at any time. More on that in Bayesian A/B testing for marketers.
Let a bandit allocate traffic. When you’d rather earn during the test than publish a clean paper afterwards, a multi-armed bandit shifts traffic toward the higher-RPV variant as evidence builds. See multi-armed bandit vs A/B testing.
Cap outliers. One $5,000 order in one arm shouldn’t decide a test on a $97 product. Cap order values at a sensible ceiling before the metric is computed.
Which metric for which page
The pattern is simple: the closer a page sits to money, the more the primary metric should be money.
Page you’re testing | Primary metric | Guardrails |
|---|---|---|
Opt-in / lead magnet | Lead rate (CVR) | Downstream purchase rate, if you can attribute it |
Sales page / VSL | Revenue per visitor | Checkout rate, refund rate |
Order form / checkout | Revenue per visitor (whole funnel) | Checkout completion rate |
Order bump | Revenue per visitor | Main-offer conversion rate |
Upsell / OTO | Revenue per funnel visitor | Take rate, refund rate |
Downsell | Revenue per funnel visitor | Take rate |
SaaS pricing page | Revenue per visitor or trial-to-paid | Trial starts |
Booking page (services) | Booked calls, or won-deal revenue | Form submit rate |
The one place conversion rate is the honest primary metric is a lead capture page where nothing is sold yet. Even there, attribute downstream revenue back to the variant when you can, so you catch the page that collects lots of emails from people who never buy.
How to set this up
You need three things: revenue events that actually reach your testing tool, a way to tie each event to the variant the visitor saw, and a tool that can make RPV the primary metric with conversion rate as a guardrail.
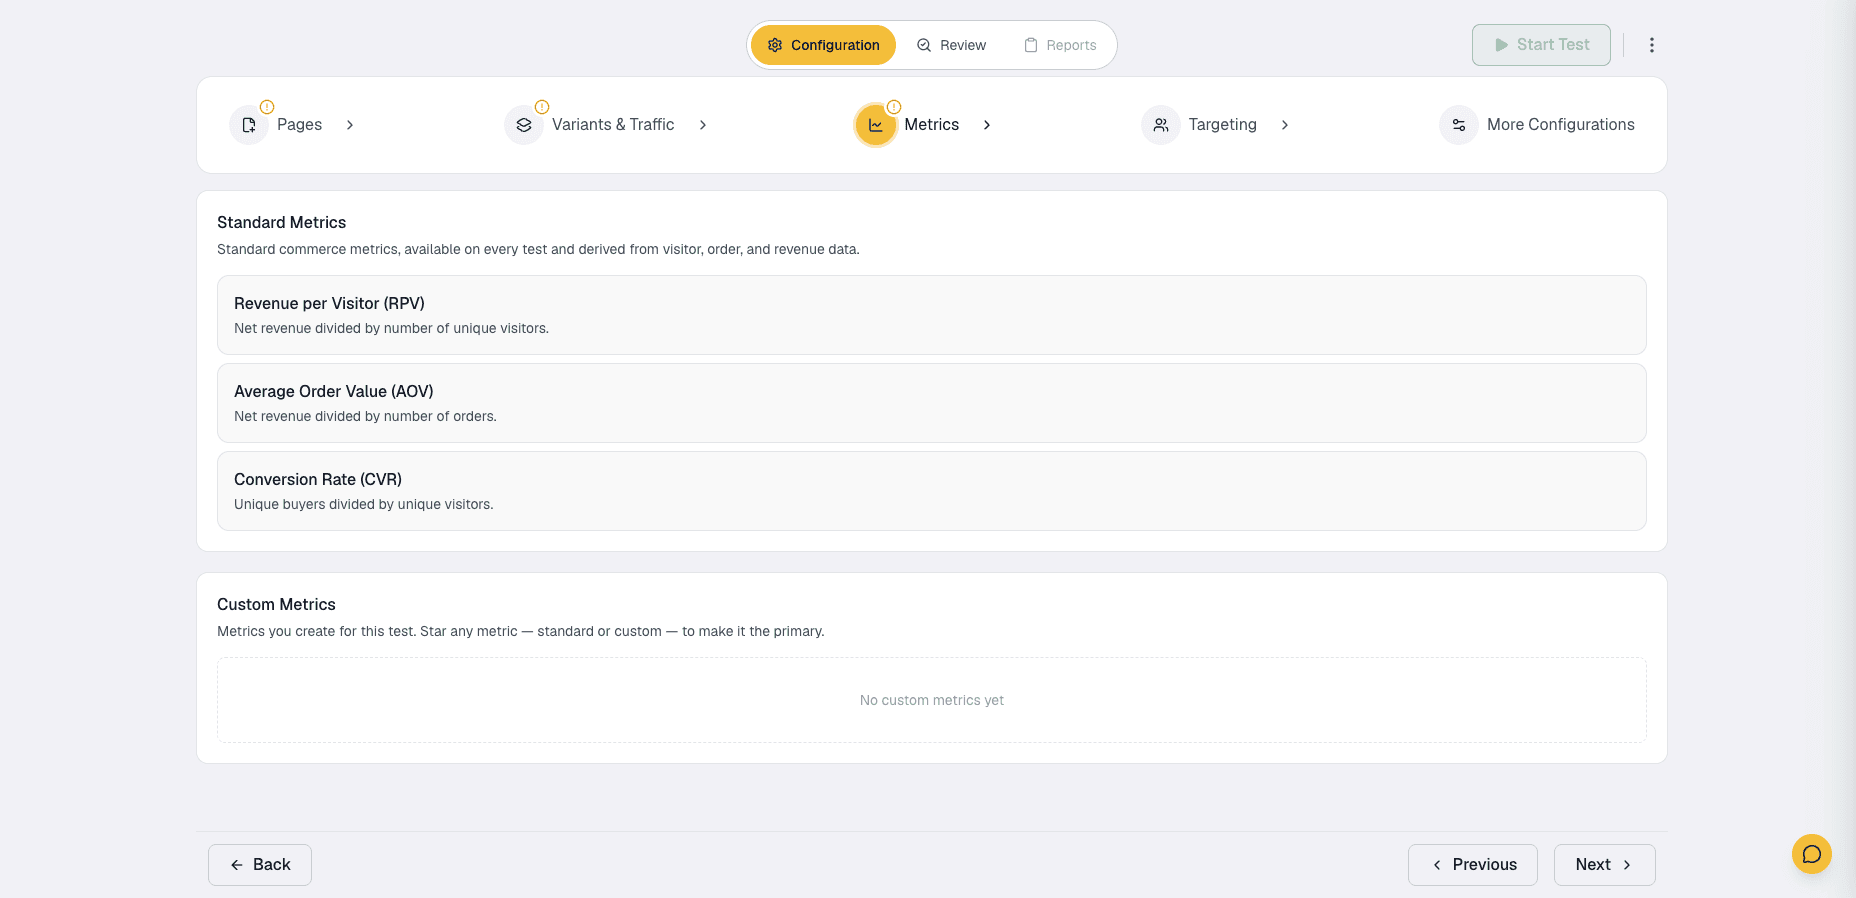
Every Splitlab test comes with RPV, AOV and CVR built in. Star one to make it the primary; the rest become guardrails.
In Splitlab it looks like this.
Connect your funnel or payment platform. The ClickFunnels 2.0 integration sends every order, subscription and opt-in by webhook. Refunds and failed payments are deducted, so you’re optimizing net revenue rather than gross.
Star revenue per visitor as the primary metric when you create the test. Conversion rate and AOV are already there as standard metrics; leave them as guardrails.
Decide how to count subscriptions. First payment is the conservative default. Predicted lifetime value is possible but it makes the metric slower and noisier.
Set an outlier cap on order value if you sell anything with a wide price range.
Read the result as a decision, not a p-value. “Variant B has a 96% probability of higher revenue per visitor, and if we’re wrong we expect to lose about $0.04 per visitor.” You can act on that sentence.
The short version
Conversion rate answers “did they click?”. Revenue per visitor answers “did we make more money?”. For any page that sells something, only the second question matters, and a test that asks the first one will eventually crown a variant that costs you money.
Use RPV as the primary metric on money pages. Keep CVR as a guardrail. Accept that revenue tests need more traffic, and cover the gap with bigger swings, Bayesian reads and bandit allocation rather than by measuring the wrong thing very precisely.
Frequently asked questions
Is revenue per visitor the same as average order value?
No. Average order value only looks at people who bought. Revenue per visitor divides total revenue by everyone who arrived, buyers or not, so it accounts for conversion rate too. RPV equals CVR multiplied by AOV.
Should I use revenue per visitor on a lead generation page?
Usually not as the primary metric, because no money changes hands on that page. Use lead rate as the primary and, if your CRM or funnel platform can attribute closed deals back to the visitor, track downstream revenue as a secondary metric.
How much more traffic does a revenue test need?
It depends on how spread out your order values are. One product at one price behaves almost like a conversion metric. A funnel with a $27 front end and a $997 upsell has far higher variance and may need several times the sample. Bigger test effects, Bayesian analysis and outlier caps all bring the requirement down.
What about refunds?
Count them. A variant that sells more and refunds more is not a win. Connect your payment source so refunds are deducted from the variant that earned the original charge, and add refund rate as a guardrail on any test that changes the offer or the promise.
Can conversion rate and revenue per visitor point in opposite directions?
Yes, and it’s common. Any change that lowers the price, adds a discount or steers buyers toward a cheaper option tends to raise conversion rate and lower AOV at the same time. Whether RPV goes up or down depends on which effect is bigger, which is exactly why you need to measure it directly.
Ready to test for revenue instead of clicks? Splitlab credits every order, bump, upsell and refund to the variant that produced it. Run your first test or book a demo.
Built for revenue
Test for revenue, not just clicks.
Run A/B, multivariate, and multi-armed bandit experiments — with real revenue tied to every variation.
✓
Revenue per variation
✓
A/B & MVT
✓
Multi-armed bandit
Test for revenue, not just clicks.
A/B, multivariate, and multi-armed bandit experiments — with real revenue tied to every variation.